

Business Risk Index: Business activity back to pre-COVID levels but for how long?; High risk regions - six of the 10 worst are in Western Sydney
The March 2023 CreditorWatch Business Risk Index (BRI) has revealed, on multiple indicators, that business activity has returned to pre-COVID levels despite continued high inflation and interest rates. The question is how long will it remain there, given dire predictions for a global economic downturn like the IMF issued last week?
Key Business Risk Index insights for March:
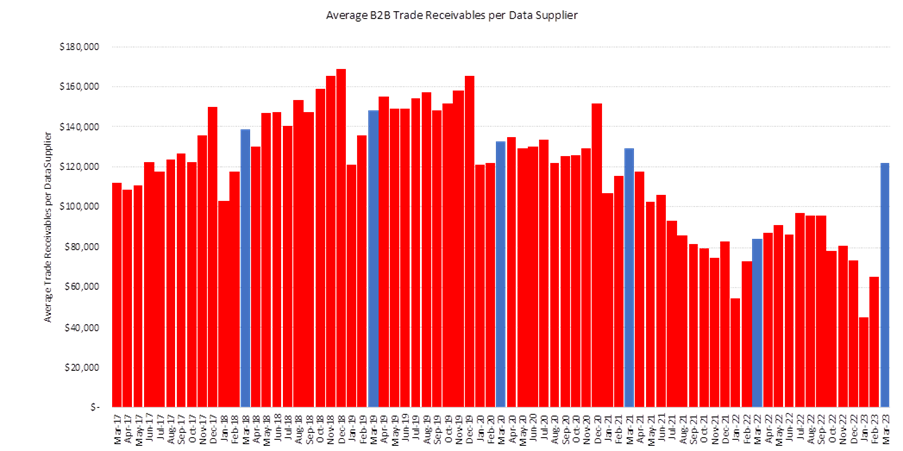
· B2B trade receivables are up 45% YoY due, in part, to rising inflation but also a resumption of ‘normal’ trading activity post-COVID.
· External administrations rose 35% YoY, in line with the increase in trading activity.
· Court actions back to pre-COVID levels and up 22% YoY.
· Credit enquiries rose 28% from February to March were up a massive 149% year-on-year.
· B2B trade payment defaults are up 20% year-on-year following a seasonal dip in December and January.
· Six of the 10 highest ranking regions in Australia for probability of default are located in Western Sydney due to four key indicators: low median income, high population density and low positions on the ABS’s Index of Relative Social Advantage and Index of Economic Opportunity.
· Norwood-Payneham-St Peters in South Australia is the region with the lowest insolvency risk (across regions with more than 5,000 businesses), followed by Yarra Ranges in Victoria.
· Food and Beverage Services remains the industry at highest risk of default, due to its reliance on discretionary spending, which is in decline, as well as ongoing challenges such as labour shortages.
· External administrations in the construction industry continue to trend upward – sitting at a their highest point since July 2020.
Average trade receivables for March were sitting at $122,223, just eight per cent below the March 2020 figure. This upward trend can be attributed to high work volumes that businesses are working through and the impacts of inflation.
The increase in receivables was consistent with the Australian Bureau of Statistics’ (ABS) Monthly Business Turnover Indicator for February, which showed year-on-year increases in turnover across nine of 13 industries. Construction recorded the highest month-on-month increase in business turnover at 4.6%.
The Business Risk Index also revealed that external administrations continue to trend upward, in line with the increase in business activity, high inflation and creditors ramping up collection activity. They rose 35% year-on-year in March. Court actions also continue to increase – up 22% year-on-year and 1.5% above the March 2020 level.
Another indicator of the rising level of business activity, credit enquiries, rose 28% from February to March and is up a massive 149% year-on-year. B2B trade payment defaults are up 20% year-on-year following a seasonal dip in December and January.
Turning to regional analysis, the March data also shows that six of the 10 highest ranking regions in Australia for probability of default are located in Western Sydney. Our analysis shows that this is a function of four key indicators: low median income, high population density and low positions on the ABS’s Index of Relative Social Advantage and Index of Economic Opportunity. The fact that the biggest industries in these regions are construction and transport, postal and warehousing – both under considerable pressure – has also played a part.
CreditorWatch CEO, Patrick Coghlan, says the increase in business activity in March is testament to the resilience of the Australian business community.
“From a pandemic to labour shortages, supply chain disruptions, high inflation and rising interest rates, Australian businesses have had it all thrown at them,” he says. “To now be registering these increases in turnover is a very encouraging sign. However, we can’t ignore the forecasts for more tough times ahead as demand drops and cost pressures remain.
“However, these current increases in turnover mean that businesses will thankfully be in a stronger position as conditions tighten.”
CreditorWatch Chief Economist, Anneke Thompson, says the increase in trade receivables and monthly business activity can partly be explained by the still very high workloads that many industries are still dealing with.
“The construction industry, in particular, is still working through very high volumes of work and is invoicing at a very high rate,” she says. “It is the cost side that is really damaging to this sector at the moment, with many projects being completed at a substantial financial loss to the builder due to the price the owner pays being fixed at the time of contract signing.”
Best regions and capital cities (5,000+ businesses)

Sources: CreditorWatch Business Risk Index and ABS
Worst regions (5,000+ businesses)

Sources: CreditorWatch Business Risk Index and ABS

Western Sydney is the region that we expect to be hit hardest by insolvencies over the next 12 months. Relative levels of debt are high in this region and there are many small businesses that are very sensitive to even slight movements in demand. On the other hand, the areas we predict to have the lowest levels of insolvency tend to have many long term businesses that have more established cash flow and much lower levels of debt.
Trade receivables
Data Sources: CreditorWatch trade receivables data (accounting software integration)
External Administrations

Data Sources: CreditorWatch trade receivables data (accounting software integration)
All the data flowing in is predicting increasing defaults, regardless of the positive trade levels. This highlights just how damaging inflation is to an economy, as it quickly erodes any positive gains businesses get from strong demand. In this regard, the RBA is absolutely justified in its focus on reducing inflation.
As hard as high interest rates are for borrowers to contend with, the RBA at least has control over where they sit, and higher interest rates can be reduced quickly if needed. On the other hand, if inflation gets ingrained in an economy, there is no centralised mechanism to control it – indeed, it ends up controlling us - and ends up becoming a major long-term headache, and even more damaging than higher interest rates.
CreditorWatch default rate prediction
Despite the bounce back in trade activity in March, CreditorWatch forecasts B2B payment defaults to rise sharply in the latter half of 2023.
The business sector has now entered what will be some of the toughest trading conditions many have experienced for some time. Demand will reduce, particularly in sectors reliant on discretionary spending, while costs and interest rates are high. In this environment, the marginal businesses, the ones that were barely profitable in low-cost times, will find it increasingly difficult to remain solvent.

Probability of default by industry
The industries with the highest probability of default over the next 12 months are:
1. Food and Beverage Services: 7.34%
2. Transport, Postal and Warehousing: 4.78%
3. Arts and Recreation Services: 4.67%
The industries with the lowest probability of default over the next 12 months are:
1. Health Care and Social Assistance: 3.28%
2. Agriculture, Forestry and Fishing: 3.59%
3. Wholesale Trade: 3.67%
Source: CreditorWatch risk score credit rating average probability of default by industry. Default defined as external administration, strike-off or deregistration in the next 12 months
Industry insolvency rates

Source: CreditorWatch Business Risk Index March 2023
The food and beverage sector continues to stand out as being the one at most risk. Insolvencies in the construction sector do make the headlines as they are often large businesses and there are many people impacted – including those having their homes built. Food and beverage insolvencies are often smaller businesses, and because the impact is somewhat ‘ring-fenced’ to the operators of the business, the wider impact to the economy is lower.
Construction industry insolvency rates
Unsurprisingly, insolvency rates in the construction sector are on the rise after plummeting at the onset of the pandemic. The low rate of insolvency during the pandemic, coupled with the cost issues the sector is facing, suggests that more insolvencies are due to roll through the sector before the rate starts to stabilise as costs also start to level out.

Source: CreditorWatch Business Risk Index March 2023
Outlook
We have only recently reached ‘restrictive’ monetary policy settings, and with employment still very strong, there is a real possibility of the cash rate moving higher again after the RBA’s May board meeting. It is likely monetary policy will need to be restrictive for some time before the central bank considers the next course of action.
Strong employment continues to be a bright spot for Australia, however, it does unfortunately contribute to the inflation problem. Still, it looks like we have avoided the dreaded price-wage spiral, which is a big positive. We anticipate that household spending is about to get even lower (per capita) as many fixed rate loans move to much higher variable rates. This will help to get inflation down at a faster rate, which should show up in September CPI data.
ABOUT THE BUSINESS RISK INDEX
The Business Risk Index is a predictive economic indicator to help guide businesses when making future growth plans and inform public policy. It is a new credit rating that ranks more than 300 Australian geographies by relative insolvency risk, providing unique insights into the health of Australian businesses by region.
Each region is ranked from best to worst in terms of the potential for businesses in it to become insolvent. The index can also measure the potential for insolvency risk at a national, state and individual business level.
Regions are ranked on a scale from zero to 100, where 100 represents the best credit quality regions, that is, the lowest risk of insolvency, and zero represents the weakest credit quality regions, that is, the highest insolvency risk.
The index is calibrated by data from approximately 1.1 million ASIC-registered, credit-active businesses. It combines these insights with CreditorWatch’s proprietary data, previously published as the monthly Business Risk Review.